To get better insights in how a team can grow and what support they need from their organization, we use the Agile Fluency® model and associated tools. In this post, we’ll share how we run an Agile Fluency team diagnostic workshop and how we use systems thinking techniques to arrive at recommendations for both the team and management.
We will show some examples from an actual diagnostic workshop we have ran with a team, but we have blurred all confidential information. We assume the reader has basic knowledge of the Agile Fluency model and its zones.
- Engaging with management and the teams
- It’s the conversation that matters
- Making sense of what’s been said
- An example pattern - handling technical debt
- Considerations
- Next steps
- References
Engaging with management and the teams
We start out with a conversation with management, i.e. the people who have the authority to decide on any investments the team needs. Together with management, we decide on objectives for the team and an appropriate fluency zone: focusing, delivering or optimizing.
Then we schedule and run a diagnostic workshop with the whole team. This workshop is an extended team retrospective. Each team member individually fills in a survey and we discuss the aggregated results together. The survey consists of a number of method-agnostic statements about team behaviour. Each team member indicates if the team shows that before on a scale from Never to Always.
The aggregated results look like this:
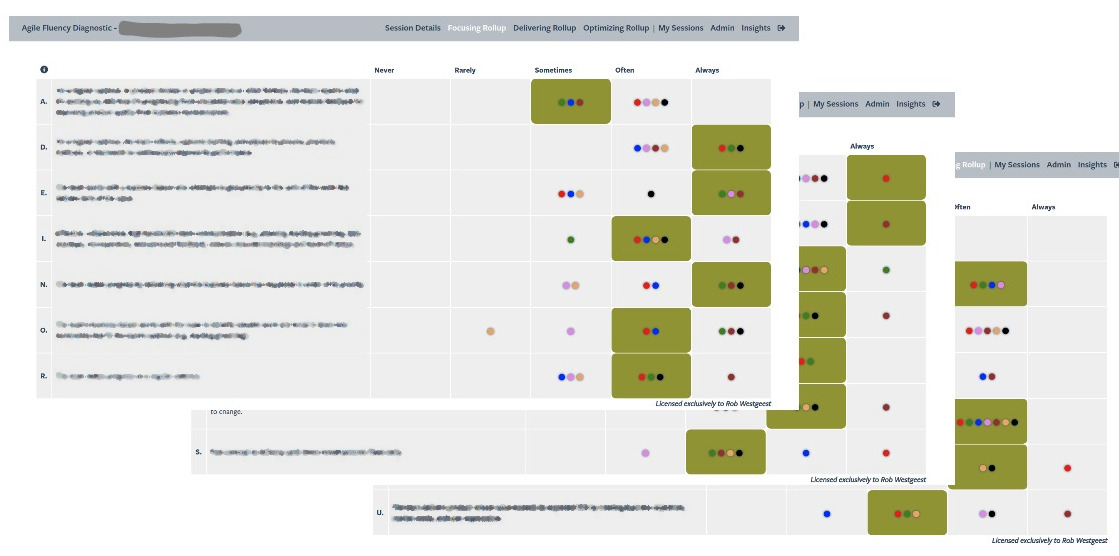
The coloured dots represent answers from different team members, the squares marked green represent the consensus answer we arrive at together with the team. It is not about perfect agreement, we aim for a good-enough answer indicative of where the team currently is.
The results do not represent the team’s ‘maturity’! Team growth is not a race to the top!
This workshop gives us rich information on how fluent the team is in the different capabilities required to get quality software out of the door now and in the future. We use the information to provide feedback and directions for growth. The workshop is a extended, guided self-assessment for the team and allows us to provide much more specific directions for growth than what usually comes out of a team retrospective.
A diagnostic workshop has two kinds of output:
- insights the participants gain themselves
- our insights based on what we see and hear from the team and on our own experience
Looking at the results above, we see that not all consensus answers are marked ‘Always’ (the rightmost column). in other words, they are not fluent in everything. This does not mean that they are a problematic team! On the contrary, this team is doing quite well, delivering changes to production every day with low defect rates. They still have opportunities however for further growth.
It’s the conversation that matters
The exact survey answers are not that relevant, it is all about the conversations that take place. The team has a conversation about how they work. Sharing different perspectives and perceptions is already valuable. Many teams we meet do not go that deep in their regular sprint retrospectives.
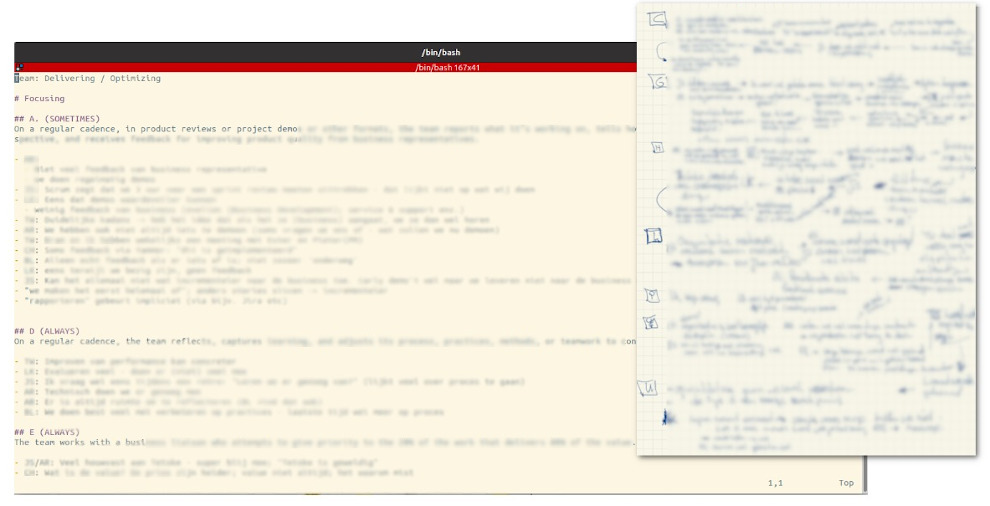
The survey statements trigger deep conversations with and within the team. We listen for signals - like someone saying “we have hardly any serious issues” - and probe what is really going on. In a time span of two hours we get rich information of how the team works and how it interacts with its context. Too much to keep in our heads, so we make many notes, like this:
Usually, we do not start giving advice or recommendations during the diagnostic workshop. We have a good night’s sleep and then try to make sense of it. We are especially interested in any systemic effects at play, things that keep the system the way it is and things that are self-reinforcing and could run out of control. By taking a systemic perspective, we can find possible interventions for the team and management that have more impact. It helps to go beyond symptoms.
Often, teams already get new insights and ideas for action from the diagnostic workshop itself. This is to be expected in a complex adaptive system like a team, where you cannot observing without influencing - “diagnosis is intervention”.
Making sense of what’s been said
To make sense of all the details, we use a technique called Diagrams of Effects, from the field of systems thinking. In a diagram of effects, we map the system in terms of variables and how these variables influence each other. We do this together as pair-facilitators.
We start writing down candidate variables on post-its. A variable is something that can increase or decrease, something that you can measure or observe in practice. This is a diverging brainstorm activity, where we mostly note down variables that we heard in the team conversation:
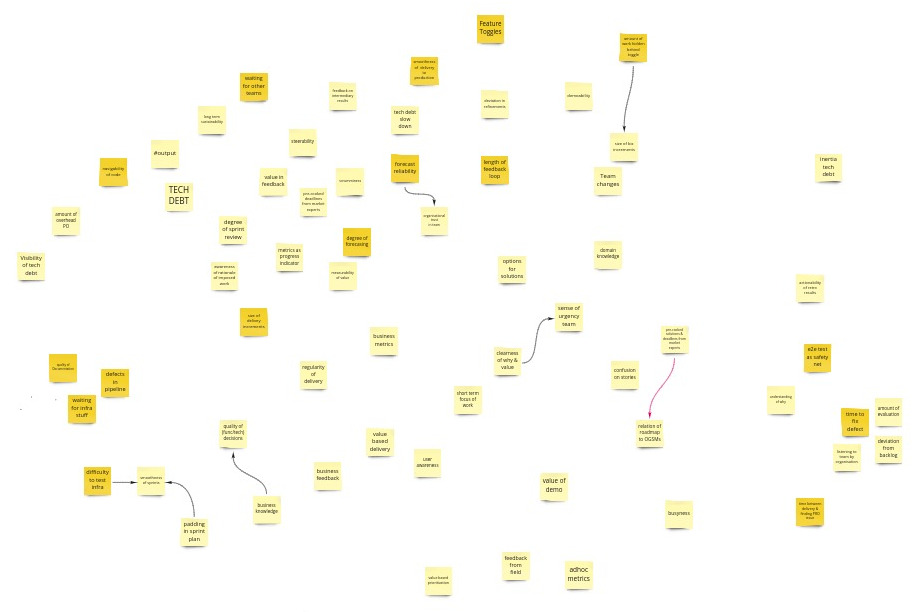
Some examples of the variables we have identified for this team:
- Smoothness of delivery to production
- Size of business increments
- Defects in CI/CD pipeline
- Clearness of Why & Value of work
- Time between delivery to production and finding a production issue
- Slow down by technical debt
In this example, the darker post-its represents variables related to the Delivering zone, and the lighter ones are related to Focusing and Optimizing.
Then we get to the daunting task of finding relations between the variables. We start drawing causal edges and challenge each other if this causal relationship is really there, or if it is an indirect relation, i.e. we’re missing a variable in between. We merge duplicate variables, and discard some that do not add much:
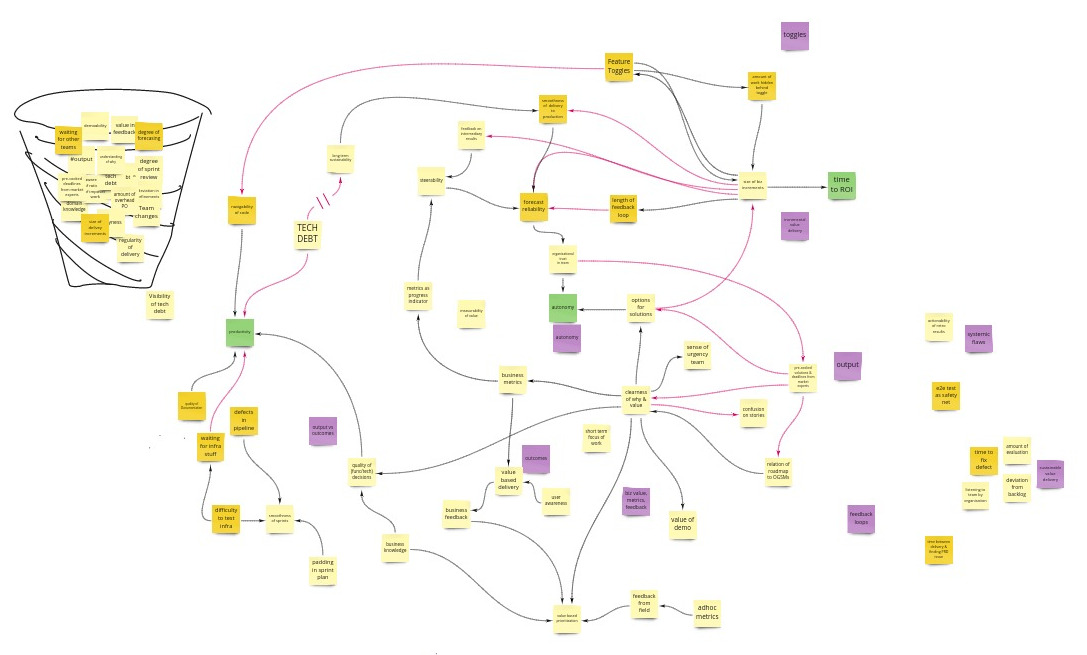
Black edges indicate a same effect: if one variable goes up, the other also tends to go up. Red edges indicate an opposite effect: if one variable goes up, the other tends to go down.
We sometimes add an explanation or some themes we noticed (the purple notes in this diagram). Or we add some benefits that are relevant for management and show how these relate to the system (the green notes).
The diagram we create is not the truth! It represents how we (as facilitators) perceive the system, based on what we heard from management and from the team, what we heard between the lines, and on our own experience. We will not present such a diagram as ‘the way things are’. Instead, we use these diagrams to illustrate how we see the system, and how we think the team can make more effective steps for growth.
The diagram above is way to big and complicated, so we look for ways to present it in a more manageable way. In this case, we noticed that there were actually 3 systems in place. Of course, everything is connected, but splitting it up in three smaller diagrams allows us to present our feedback in a more focused way:
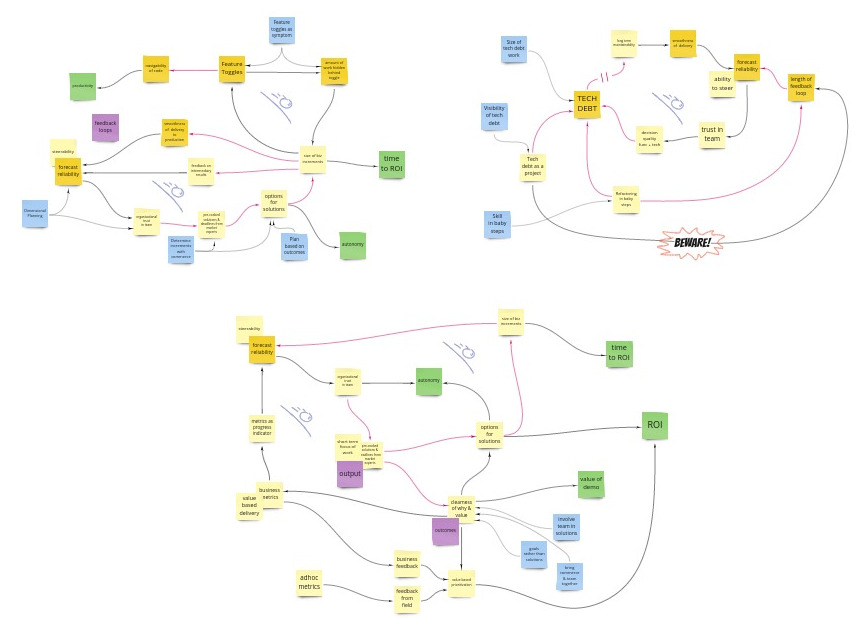
We have identified a number of self-reinforcing loops in the diagrams, represented by the small snowballs.
You may recognize some of the variables and dynamics we describe. If your team has a similar context, you will probably see similar patterns at play.
Having done fluency workshops with different teams in different organizations, we often see similar patterns recurring.
An example pattern - handling technical debt
Let’s have a look at one of the smaller diagrams. It is about handling technical debt.
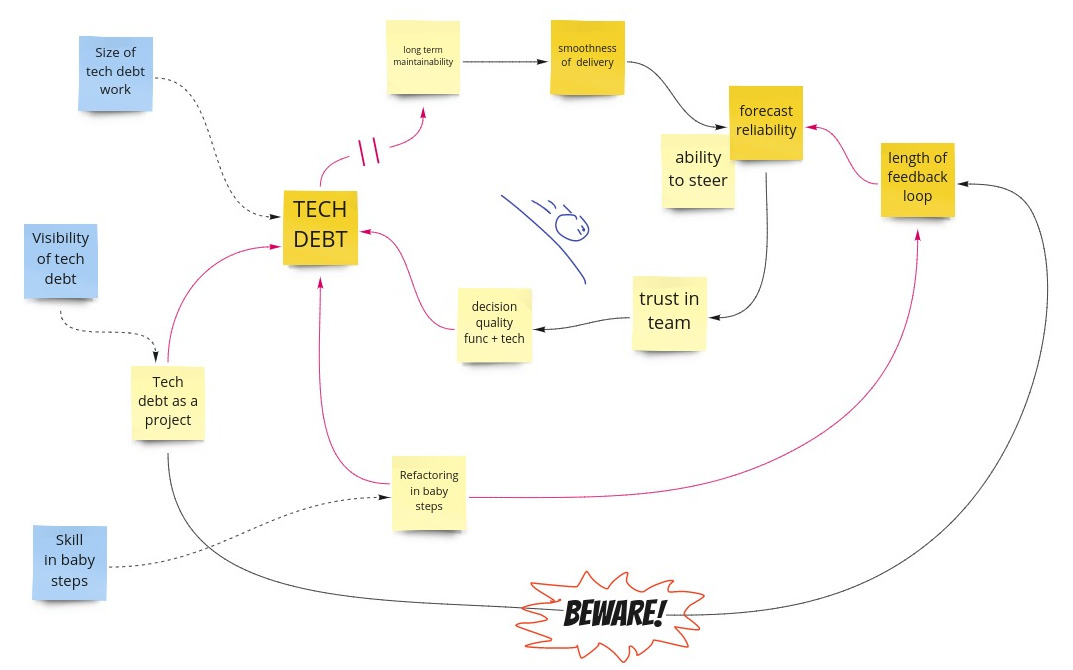
We noticed a self-reinforcing loop: over time, more Technical debt means Long term maintainability goes down, reducing Smoothness of Delivery. Lower Smoothness of Delivery reduces Forecast reliability, which reduces the organization’s Ability to steer development initiatives. This lowers the organization’s Trust in the team, which negatively impacts the quality of both functional and technical decisions. This increases Technical debt, and so on.
A way of tackling this is reducing technical debt as a project. This requires more visibility of technical debt in terms of short term and long term business impact. Tackling technical debt as a project does have several disadvantages, for instance increasing the length of development feedback loops. A technical debt project tends to be complex and unpredictable, which impacts Forecast reliability negatively. This is why we put a big Beware! in the diagram. Although this way of tackling technical debt is not inherently bad, we find it important to be aware of the downsides.
A different way of handling technical debt is refactoring in (many) baby steps. By keeping the steps small, the team can get in a state where they are continuously working on technical debt in a more predictable way, while having sufficient time for other work as well. Tackling technical debt in this way requires skills however. Working in tiny, highly controlled steps sounds simple but is actually hard. A team needs practice time and possibly training and mentoring to master this skill.
Note that when we present a diagram like this to a team as part of our feedback, we will build it up in a number of steps, so that we can take the team along with the story.
Considerations
When we report back to management, we sometimes create specific diagrams of effects from a management perspective. Sometimes we reuse the diagrams we shared with the team, but only if the team consents to that.
Diagrams of effects help to go beyond symptoms and find more effective interventions. In addition, diagrams of effects are non-personal and blameless. They shift the focus away from an individual’s behaviour, to systemic aspects, to how things are organized and how that affects behaviour. This is in line with for instance Deming’s statement that 90-95% of performance is governed by the system.
Next steps
The feedback we provide to the team and to management is quite rich, so we let them sleep on it. We meet up with the team to check up how it is going and help identify experiments.
References
- Agile Fluency Model e-book
- Agile Fluency Project
- We learned Diagrams of Effects from Gerald M. Weinberg, Quality Software Management Vol. 1 Systems Thinking (1991)
- Mike Hill wrote a series of posts about the value of taking baby steps: Many More Much Smaller Steps
For more examples of diagrams of effects, see our previous posts:
Credits: thanks Willem for encouraging us to finally finish this post